Businesses generate enormous amounts of data every day — but data alone does not improve decision-making. The real challenge is transforming spreadsheets full of numbers into clear, interactive dashboards that help leaders quickly identify trends, monitor performance, and make smarter business decisions.
Unfortunately, many Excel users still rely on static reports, manual updates, and time-consuming spreadsheet processes that make reporting inefficient and difficult to maintain. Poorly designed reports can hide critical insights, reduce productivity, and create confusion instead of clarity.
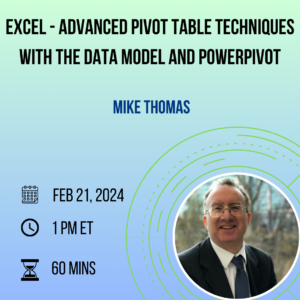
In this highly practical, hands-on training session, Excel expert Mike Thomas will show you how to build professional-looking Excel dashboards that automatically update, summarize large amounts of information, and visually communicate key business metrics with impact.
You’ll learn how to combine Pivot Tables, Pivot Charts, formulas, slicers, and automation techniques to create dynamic dashboards that transform raw data into meaningful business intelligence. Whether you work in finance, operations, accounting, administration, HR, purchasing, or management, this training will help you build reports that are more interactive, insightful, and easier to maintain
In This Training, You’ll Learn How To:
- Design clean, professional Excel dashboards that clearly communicate business performance
- Convert raw spreadsheet data into organized Excel Tables for easier reporting and automation
- Build powerful Pivot Tables to summarize and analyze large data sets quickly
- Create Pivot Charts and visual reports that highlight trends and KPIs
- Use slicers to add interactive filtering and improve dashboard usability
- Develop rolling summaries and KPI metrics for ongoing performance tracking
- Apply formulas such as SUMIFS, TEXT, and other functions to automate calculations
- Create dashboards that automatically update when new data is added
- Improve report presentation with formatting, layouts, shapes, and visual enhancements
- Protect important formulas and dashboard components from accidental changes
- Reduce manual reporting time through automation techniques and simple macros
- Build dashboards executives and managers can actually use to make faster decisions
Why This Training Matters
Organizations increasingly rely on business intelligence and data visualization tools to support faster, data-driven decisions. Yet many professionals still underutilize Excel’s powerful reporting capabilities — even though Excel remains one of the most widely used business intelligence tools in the workplace.
A well-designed dashboard can help your organization:
- identify trends faster,
- improve reporting accuracy,
- reduce manual spreadsheet work,
- increase productivity,
- monitor KPIs more effectively,
- and communicate insights more clearly to leadership teams.
This training focuses on practical, real-world dashboard techniques you can immediately apply
using the Excel tools you likely already have available.
Who Should Attend?
- Business Professionals
- Financial Analysts
- Accountants & Controllers
- Operations Managers
- Administrative Professionals
- HR & Payroll Staff
- Purchasing Professionals
- Data Analysts
- Office Managers
- Anyone responsible for reporting, analysis, or business dashboards
What Makes This Training Different?
This session goes beyond basic charts and spreadsheets. Instead of teaching isolated Excel features, this training demonstrates how to combine multiple tools together to create polished, interactive dashboards that provide meaningful business intelligence.
Attendees consistently praise this training for:
- practical real-world examples,
- clear step-by-step instruction,
- hands-on learning,
- and immediately usable dashboard techniques